Covid-19: Are NI's pandemic trends turning in the right direction?
 BBC
BBCWe're now into February, nearly a full year since Northern Ireland's first case of Covid-19.
And we can say that we've just exited the worst month of the pandemic to date.
The death toll in January far outstripped any other month so far.
There were more positive cases last month than at any other time and more people ended up in our hospitals because of the virus than ever before.
But there is much cause for optimism as we face into the spring - trends indicate that most of the numbers used to measure the pandemic in Northern Ireland are going in the right direction.
Death rate continues to fall
The death rate right now is fairly much comparable to the peak of the first wave of the pandemic in April.
While that is higher than anyone would want, it represents a consistent fall over the past four weeks or so.
Rather than looking at day-to-day numbers it is best to look at trends when trying to figure out how things are going in the battle against Covid-19.
A rolling average allows us to easier see whether the numbers are rising or falling overall.
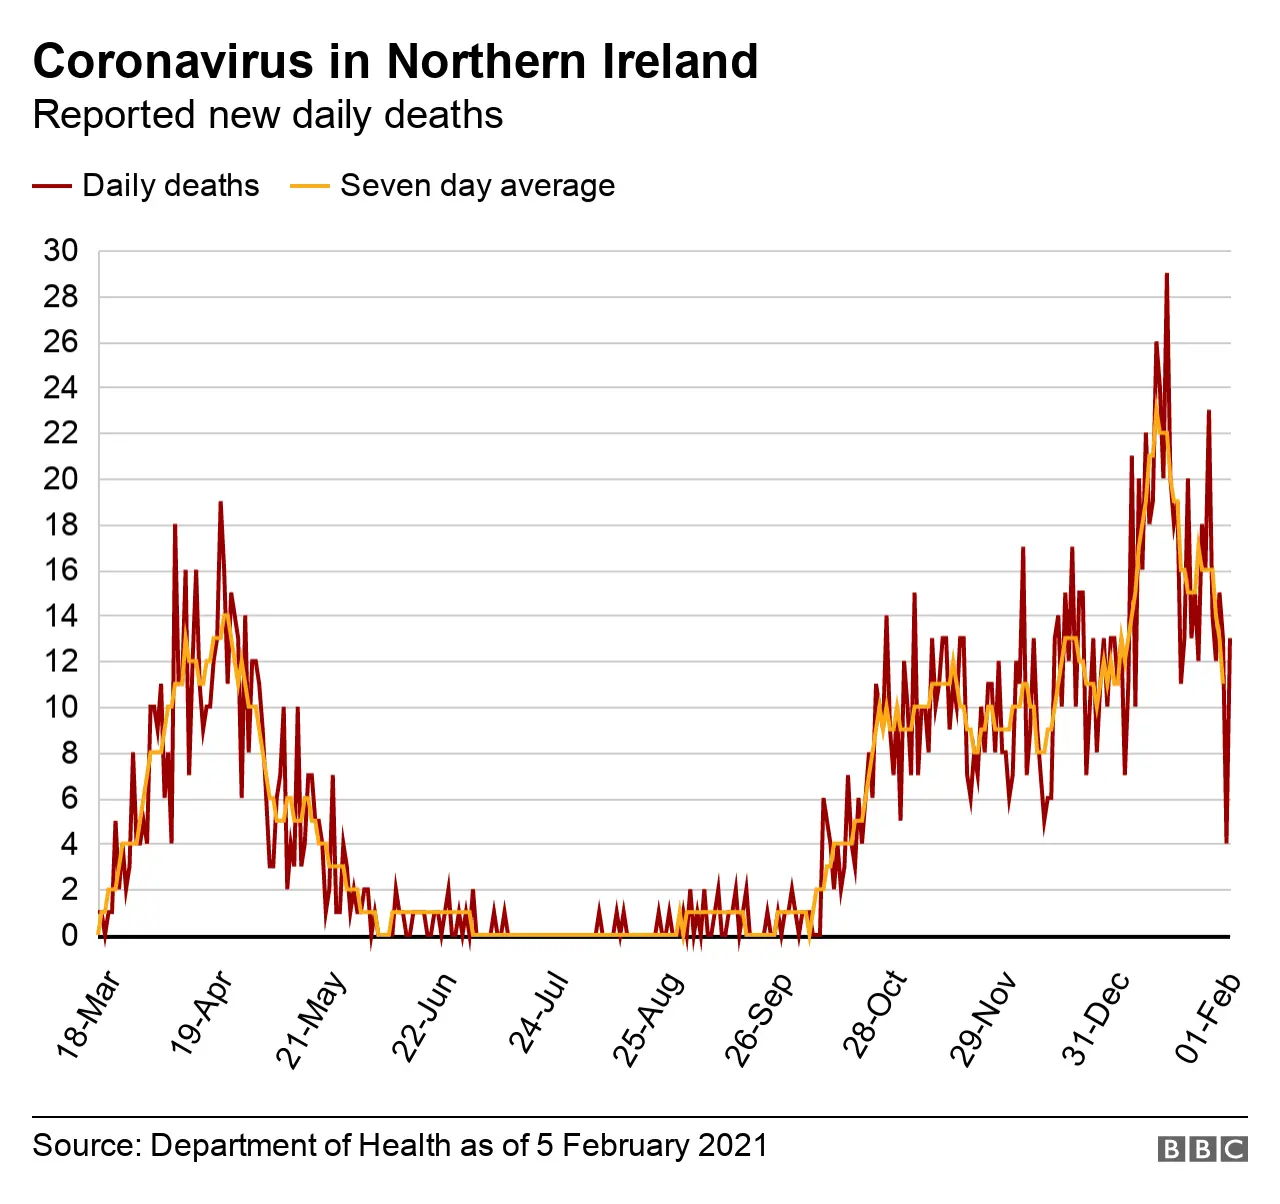
The Department of Health publishes a seven-day rolling average for Northern Ireland's Covid-19 death rate.
That figure has been falling slowly - but steadily - for about two weeks now.
That is not to ignore the fact that January was easily the worst month of the pandemic by quite some margin.
By organising the deaths reported by the Department of Health by month, it is clear just how bad January was.
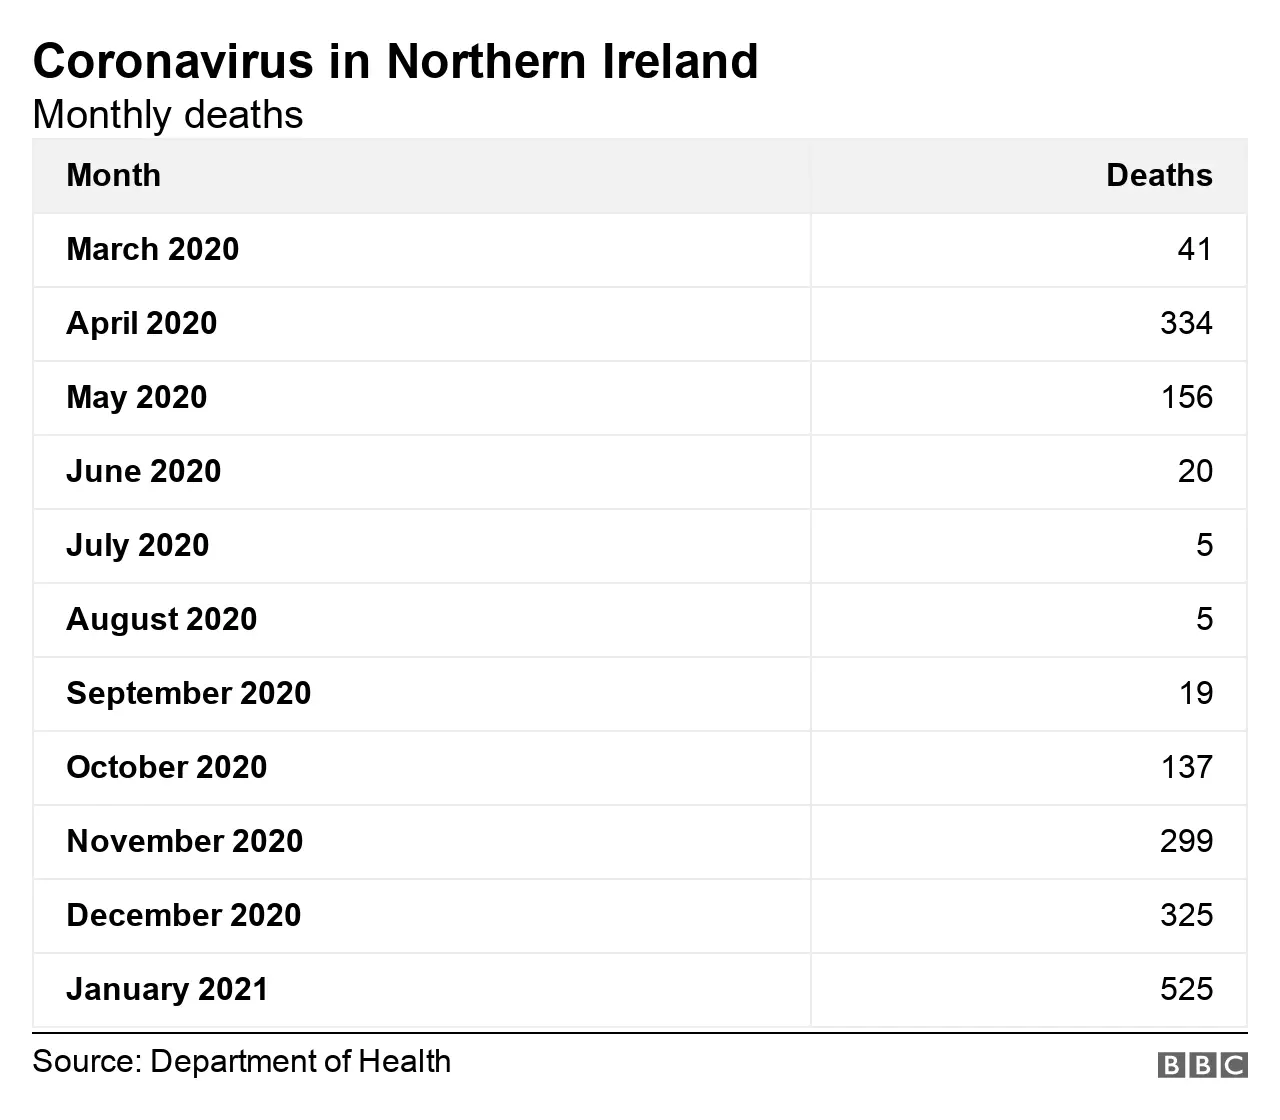
In terms of the number of Covid-19 deaths, December was roughly equivalent to the peak of the first wave in April.
But January was so much worse with more than 500 deaths.
The latest weekly update from the Northern Ireland Statistics and Research Agency (NISRA) on the number of Covid-19 deaths indicates 137 deaths where the disease was mentioned on death certificates.
That is for the week up to 29 January - it is lower than the previous week, reflecting that fall in the death rate since the worst weeks in the middle of January.
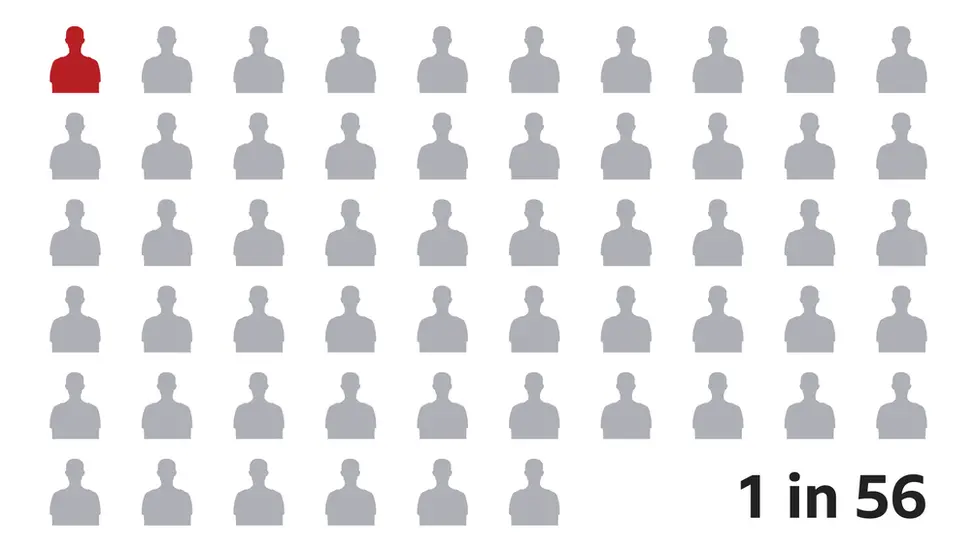
So which areas in Northern Ireland have had the worst death rates over the course of the pandemic?
The easiest way to look at this is to look at deaths by population in each of our council areas.
Mid and East Antrim along with Antrim and Newtownabbey have had the highest death rates in Northern Ireland.
The Fermanagh and Omagh Borough Council area has had the lowest.
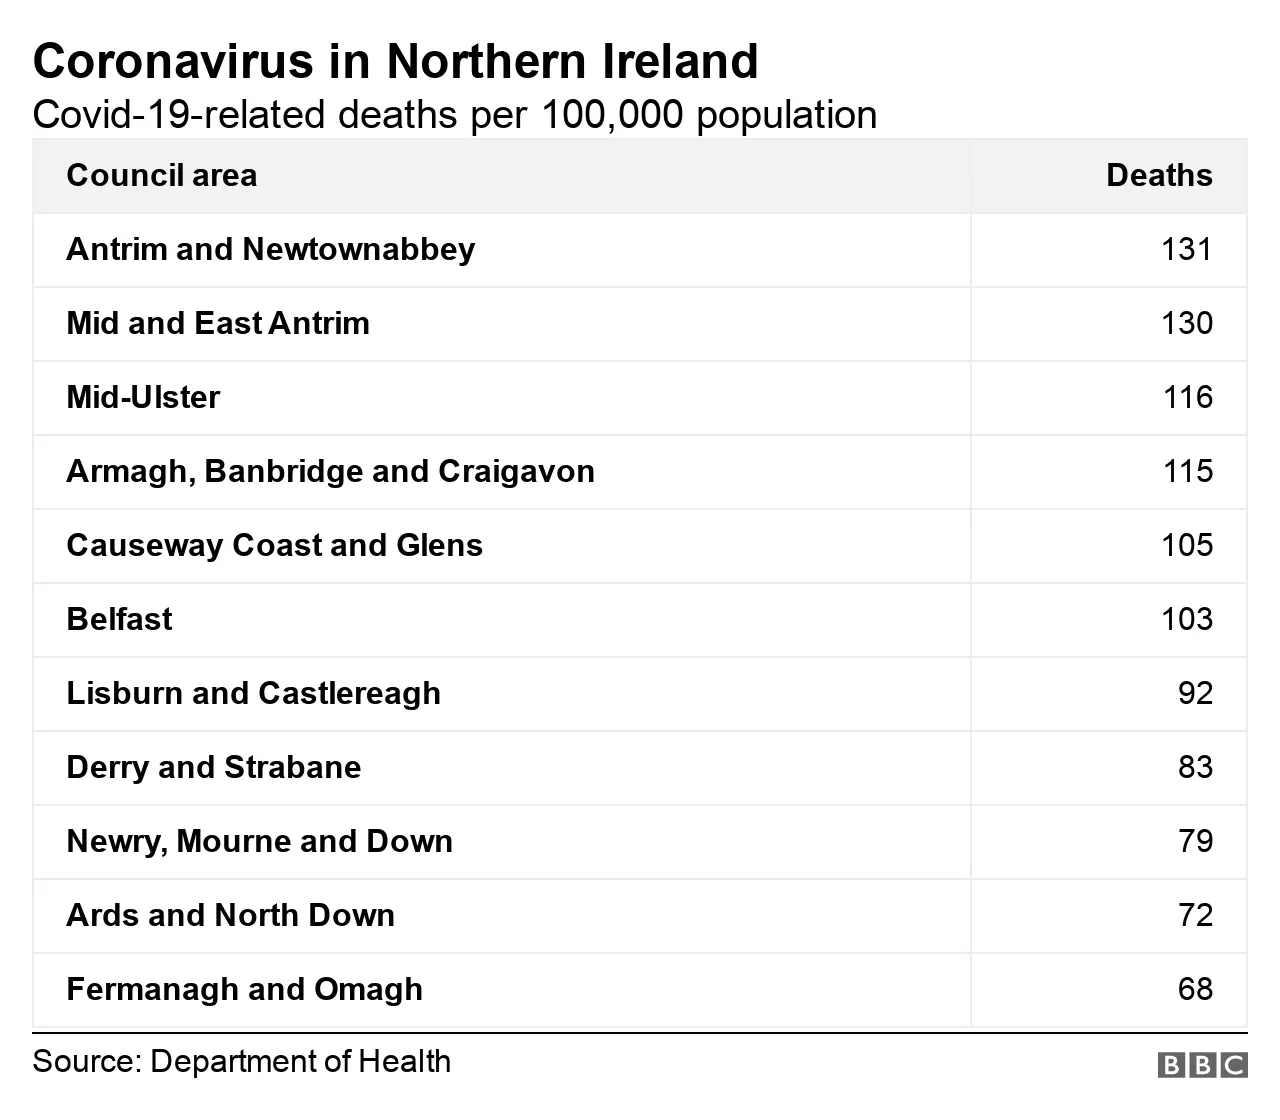
In comparison with the rest of the UK, Northern Ireland has fared better in its fatality rate during the pandemic.
Of the people who test positive for the virus, about one in every 56 in Northern Ireland has died - virtually identical to the Republic of Ireland, where the equivalent figure is one in 57.
Great Britain has a much higher death rate when measured this way - it is about 1 in 29 in Scotland; about one in 35 in England; and about one in 40 in Wales.
Vaccination rate falls behind England and Wales
Northern Ireland's vaccination programme continues apace - more than 275,000 people have received a vaccine.
That is just shy of 15% of Northern Ireland's entire population.
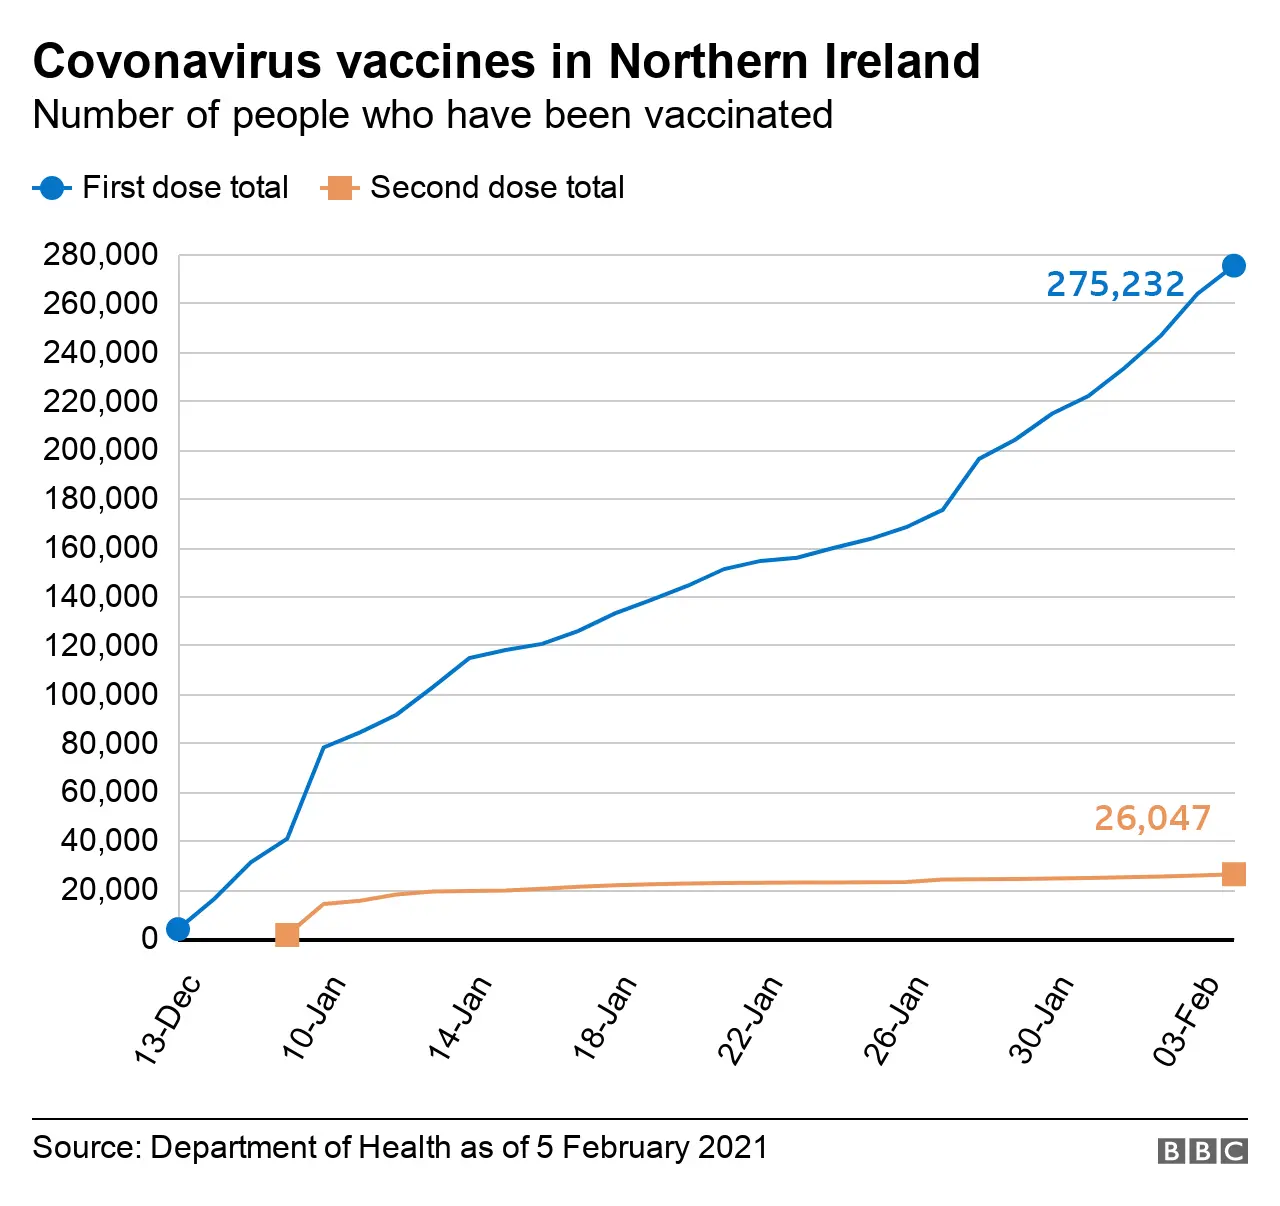
This is better than Scotland's vaccination rate (13.7%) but Northern Ireland has fallen behind Wales (16.7%) and England (16.9%).
The Republic of Ireland started its vaccination programme later than the UK and has managed to give jabs to about 3% of the population.
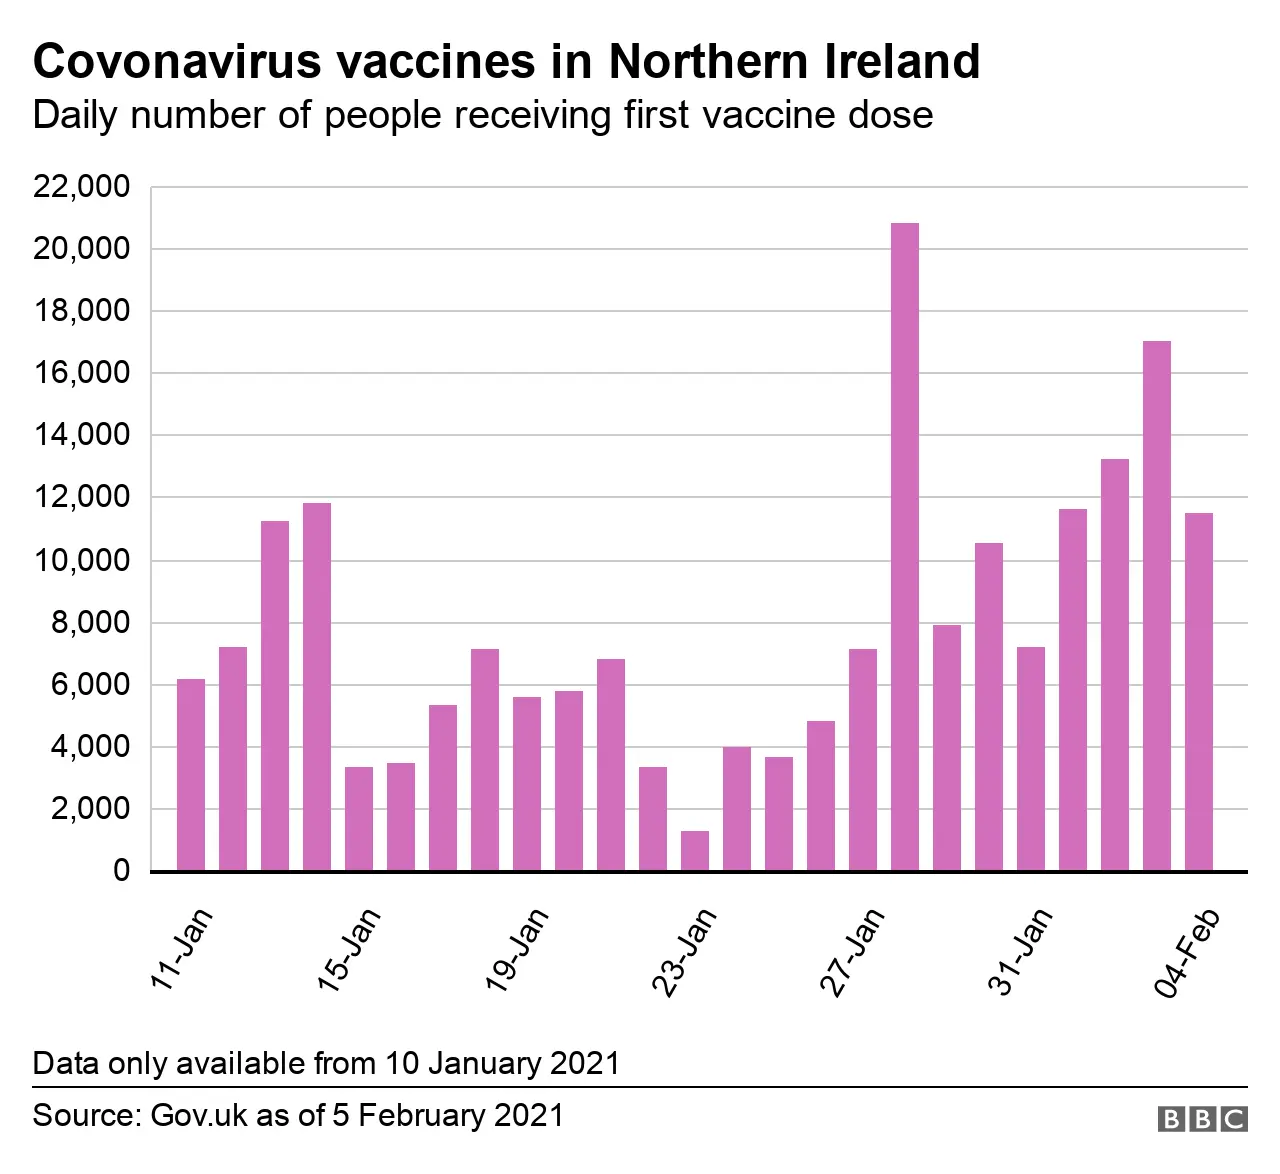
In England, Scotland and Wales the authorities provide frequent data on the numbers of people getting the vaccine, broken down by age; by residential area; by priority group; and by health trust area.
That means it is easy to see how the vaccinations are progressing for particular groups of people or geographical areas.
Apart from some updates on Twitter, the Department of Health in Northern Ireland does not provide anything like that level of detail.
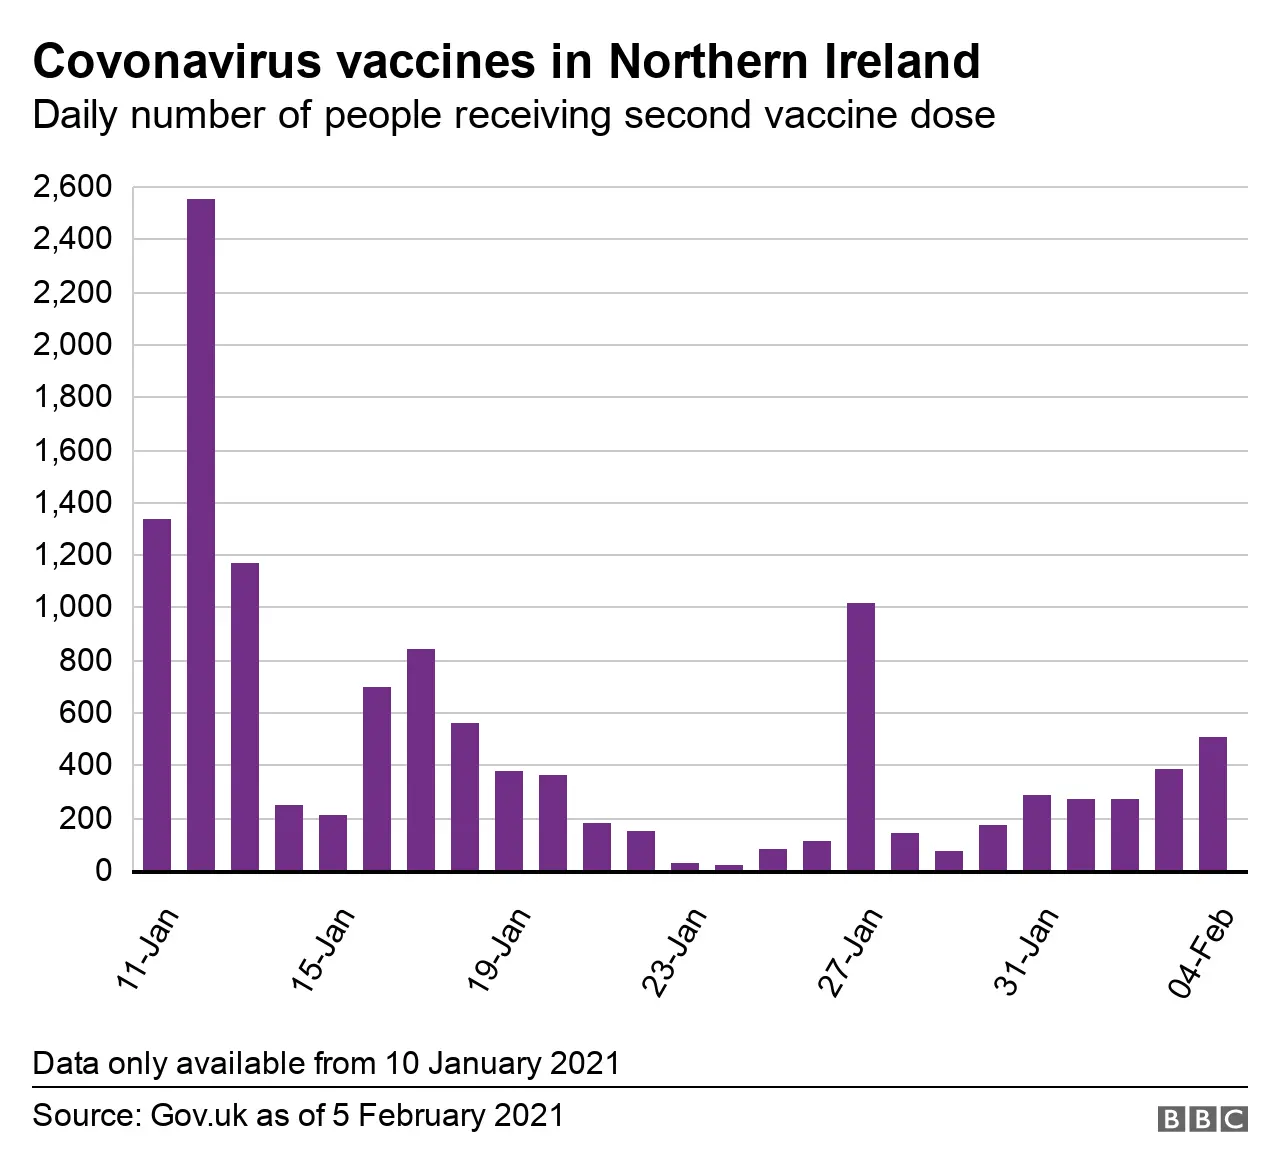
In spite of repeated requests from BBC News NI for this data, the department has so far declined to provide it, pointing instead to an upcoming digital register for vaccines.
A department spokesperson told BBC News NI: "Work is progressing on a digital reporting system for vaccination data we intend to announce in the near future.
"Daily totals are currently published on the departmental Twitter account."
Infection rate slowing down
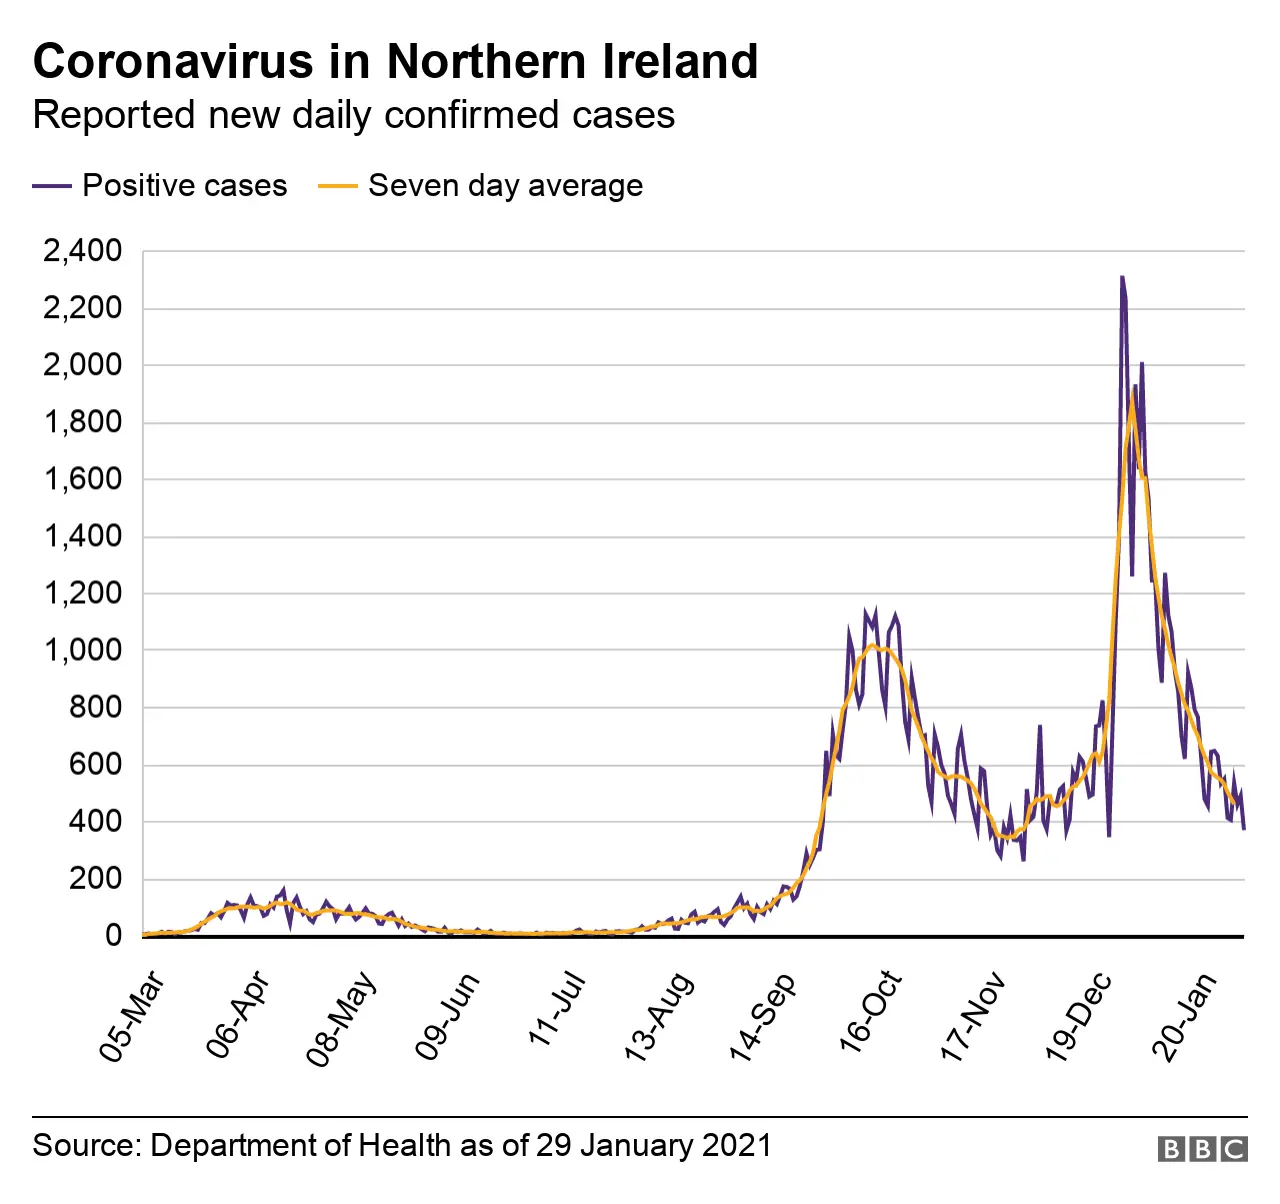
There has been a consistent and marked drop in infection rates over the past few weeks - an indication that the lockdown restrictions have been having an effect on the spread of the virus.
Most people will probably have heard by now about the R-number of the virus.
It stands for the "reproduction value" and it measures how quickly scientists reckon the virus is spreading.
Its calculation is complicated but, in simple terms, if the R-number is greater than 1.0 then the speed of the virus spread is increasing - less than 1.0 and the spread of the virus is slowing.
Northern Ireland's R-number for the general population is below 1.0 - at between 0.75-0.85 - meaning that experts believe the spread of the virus is slowing down.
And that is borne out by the available data on infections.
Figures from the BBC's Data Unit for the seven days up until 31 January show that infection rates in every one of Northern Ireland's 11 council areas have fallen over the past week.
And that comes after about three weeks' worth of a similar trend.
That fall in infection rates is in line with virtually all areas of the UK - all but 10 of the UK's 377 council areas saw a fall in infection rates this week and the rises were all marginal increases.
One area deserving of special mention is that covered by Derry City and Strabane District Council.
Back in October it had the worst infection rate in the entire UK and was one of the first to go above the rate of 1,000 infections per 100,000 people.
Now that infection rate stands at 99 per 100,000 population - the lowest in Northern Ireland.
The Department of Health has recorded fewer people testing positive for the virus, with 540 a day over the seven days up until 2 February - that compares with 701 for the previous week.
In short, the spread of coronavirus in Northern Ireland has been substantially reduced from the nadir of mid-January.
Hospital pressure easing
Northern Ireland's hospitals and medics remain under a lot of pressure but compared with January that pressure has eased somewhat.
We still have more than 600 people in hospital.
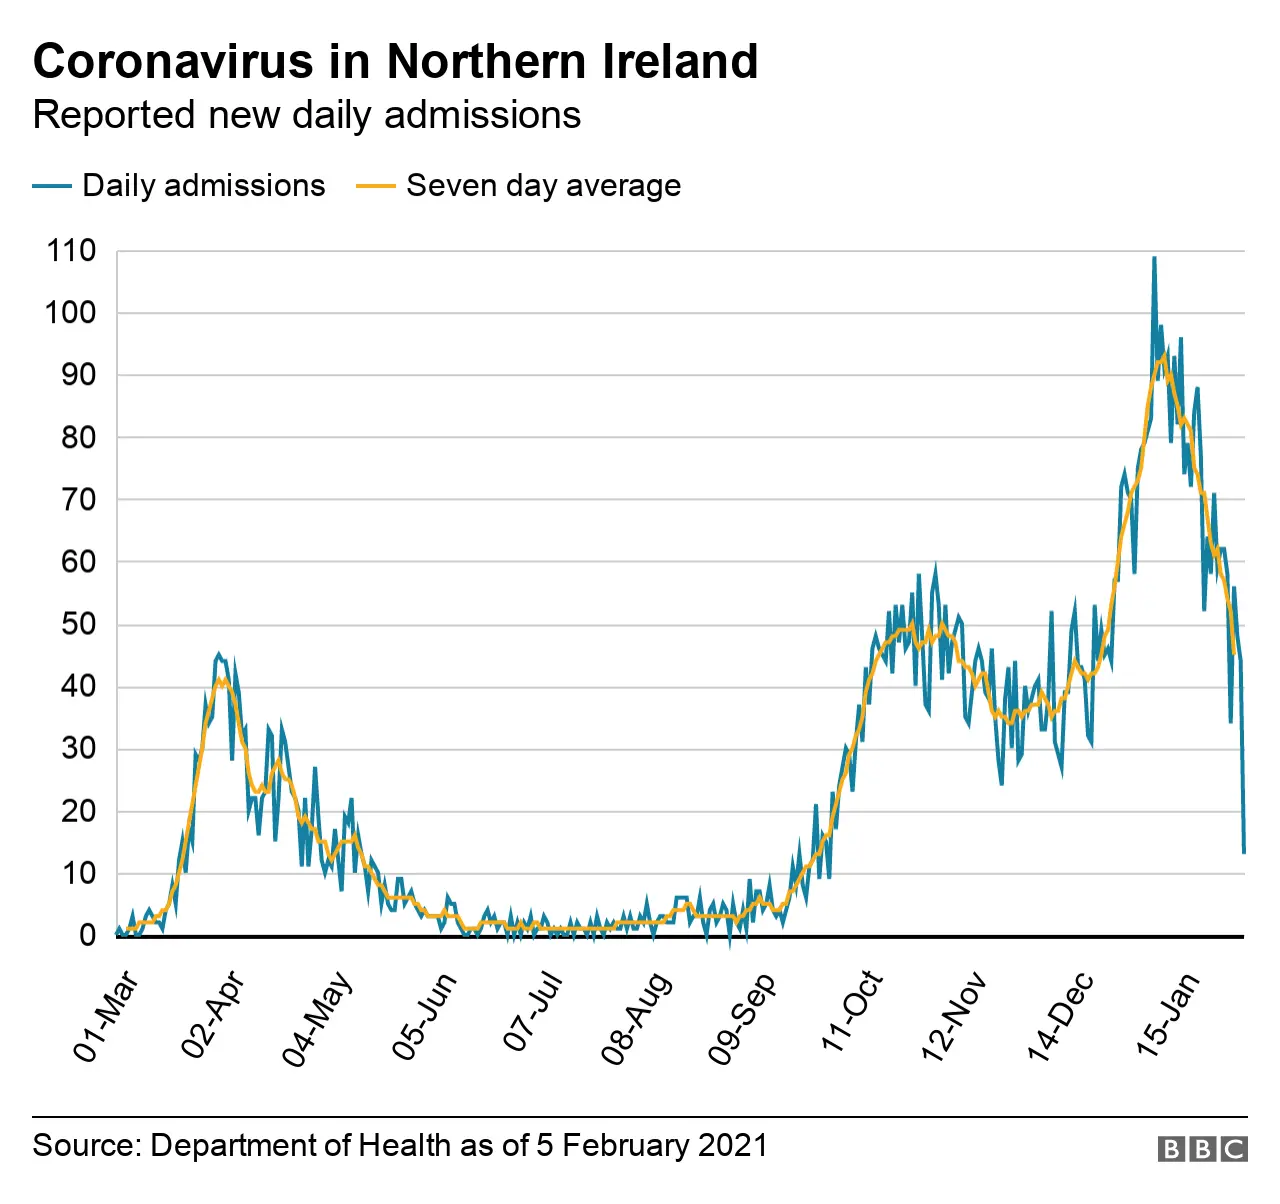
That is a lot more than were in hospital during the worst days of the first wave in April but quite a drop from the worst days of January, when there were more than 1,000 Covid-19 inpatients.
And unless something changes we will see the number of hospitalised Covid-19 patients continue to fall.
Admissions for people suffering from Covid-19 have been consistently falling for three weeks now, meaning that trend of falling inpatient numbers should continue.
That is some cause for optimism but it should be tempered by the fact that about 10% of Covid-19 inpatients are in intensive care units (ICU).
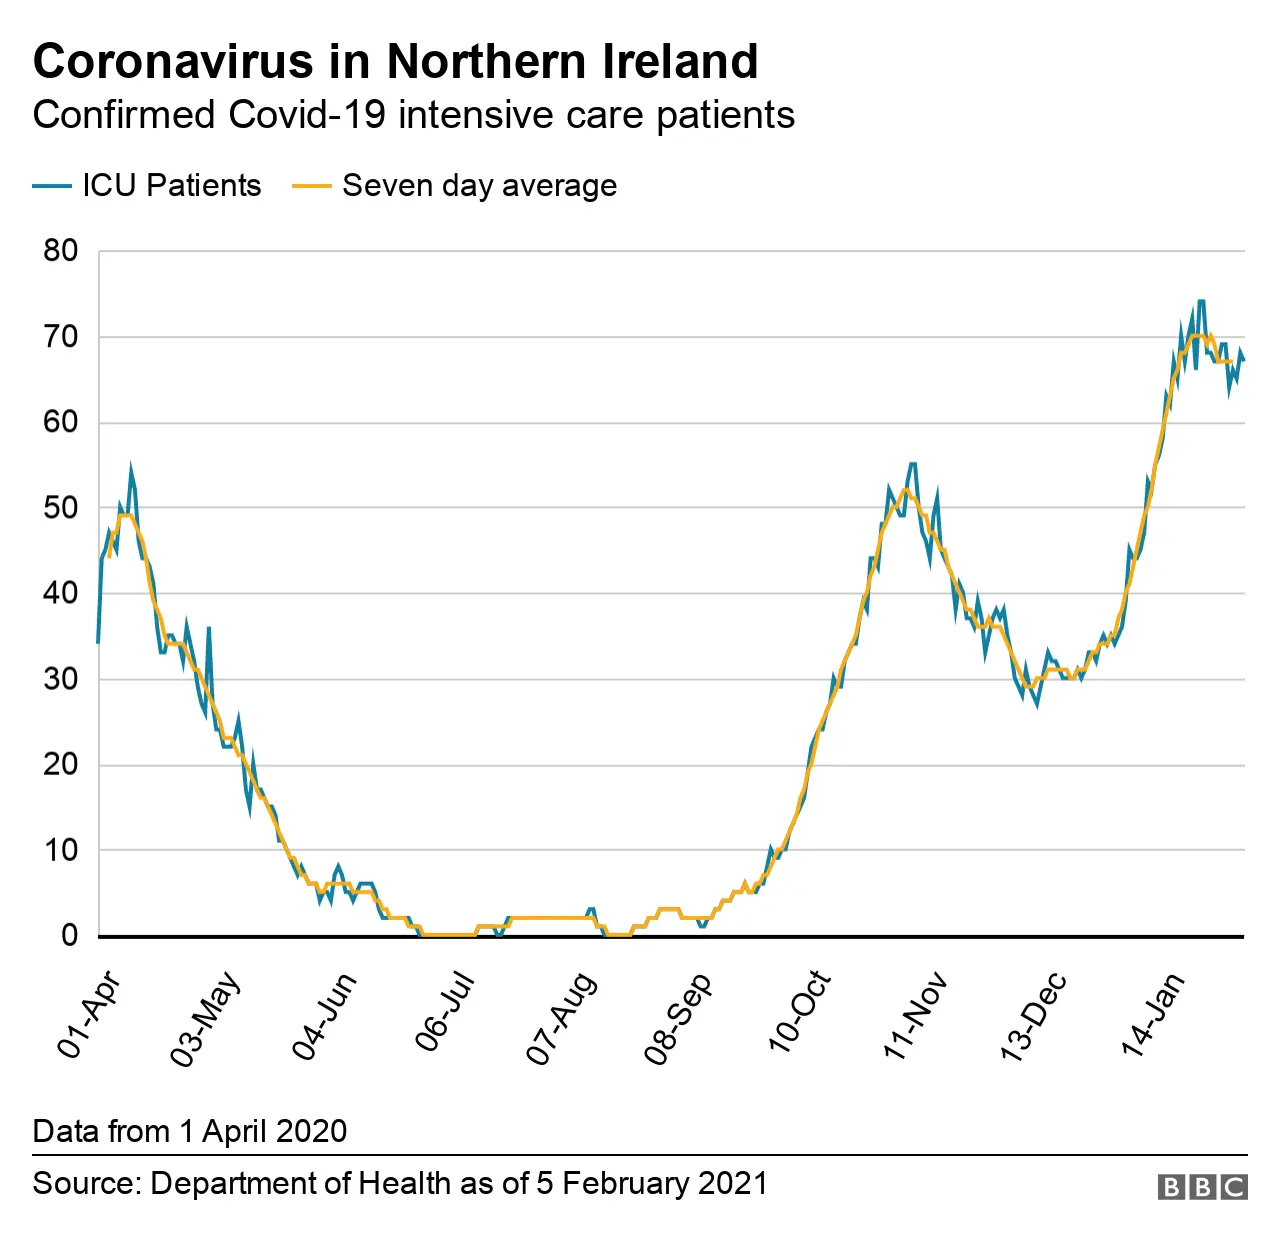
The numbers in ICU suffering from the virus have remained fairly static for the past three weeks or so - mostly between 65 and 70.
We can expect that to fall eventually because fewer people are ending up in hospital.
But it looks like that will be a slow, arduous process.
There is no getting away from the fact that we still have many people in hospital because of coronavirus and some of them are very ill indeed.
